Watch a Video: Reports in Vantage
The reports available in Vantage provide insights into your students' progress in the course. You can quickly get to the reports for any course by locating that course on your My Courses dashboard and opening the Reports page.
TIP: Report data updates once each day. To see changes, check back the following day.

If you are already in another area of your Vantage course, you can easily get to the Reports from the top navigation menu.

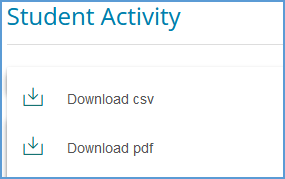
You can download any report in CSV or PDF format. Look for the download link under the report type header and choose the format you want to download.
Every question in Vantage is tied to a learning objective. The Learning Objective Performance report calculates the number of correct responses compared to the total number of questions answered for each learning objective.
The overall performance for each objective is color-coded to help you quickly see how well your students understand the material. The color codes indicate high (green), average (yellow), or low (red) levels of understanding.
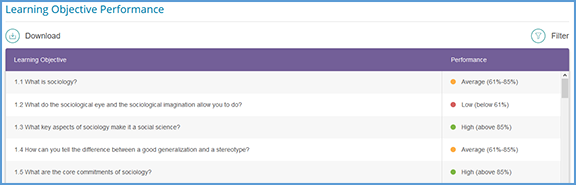
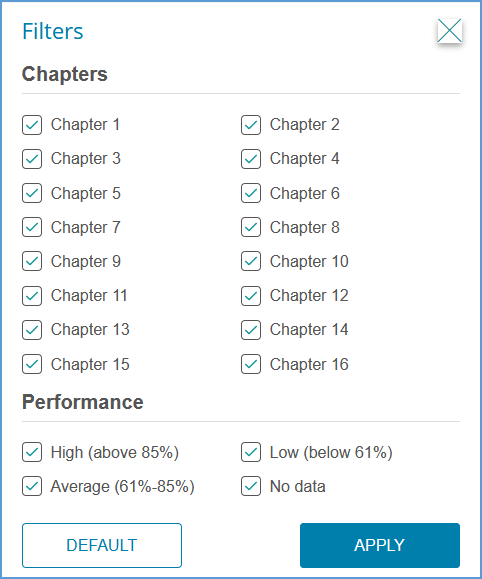
You can use the Filter menu at the top right of the report to fine tune the display. You can pick specific chapters and/or performance ranges to easily view progress day-to-day.
Was this article helpful?
That’s Great!
Thank you for your feedback
Sorry! We couldn't be helpful
Thank you for your feedback
Feedback sent
We appreciate your effort and will try to fix the article